Order flow,without the clutter.
Footprint, DOM, heatmap, volume profile and TPO in one fast workspace for futures traders. Add only what you use, arrange it your way, and keep the whole setup.
Windows 10 or 11, 64-bit. Nothing is for sale yet.
Every tool reads the same trades.
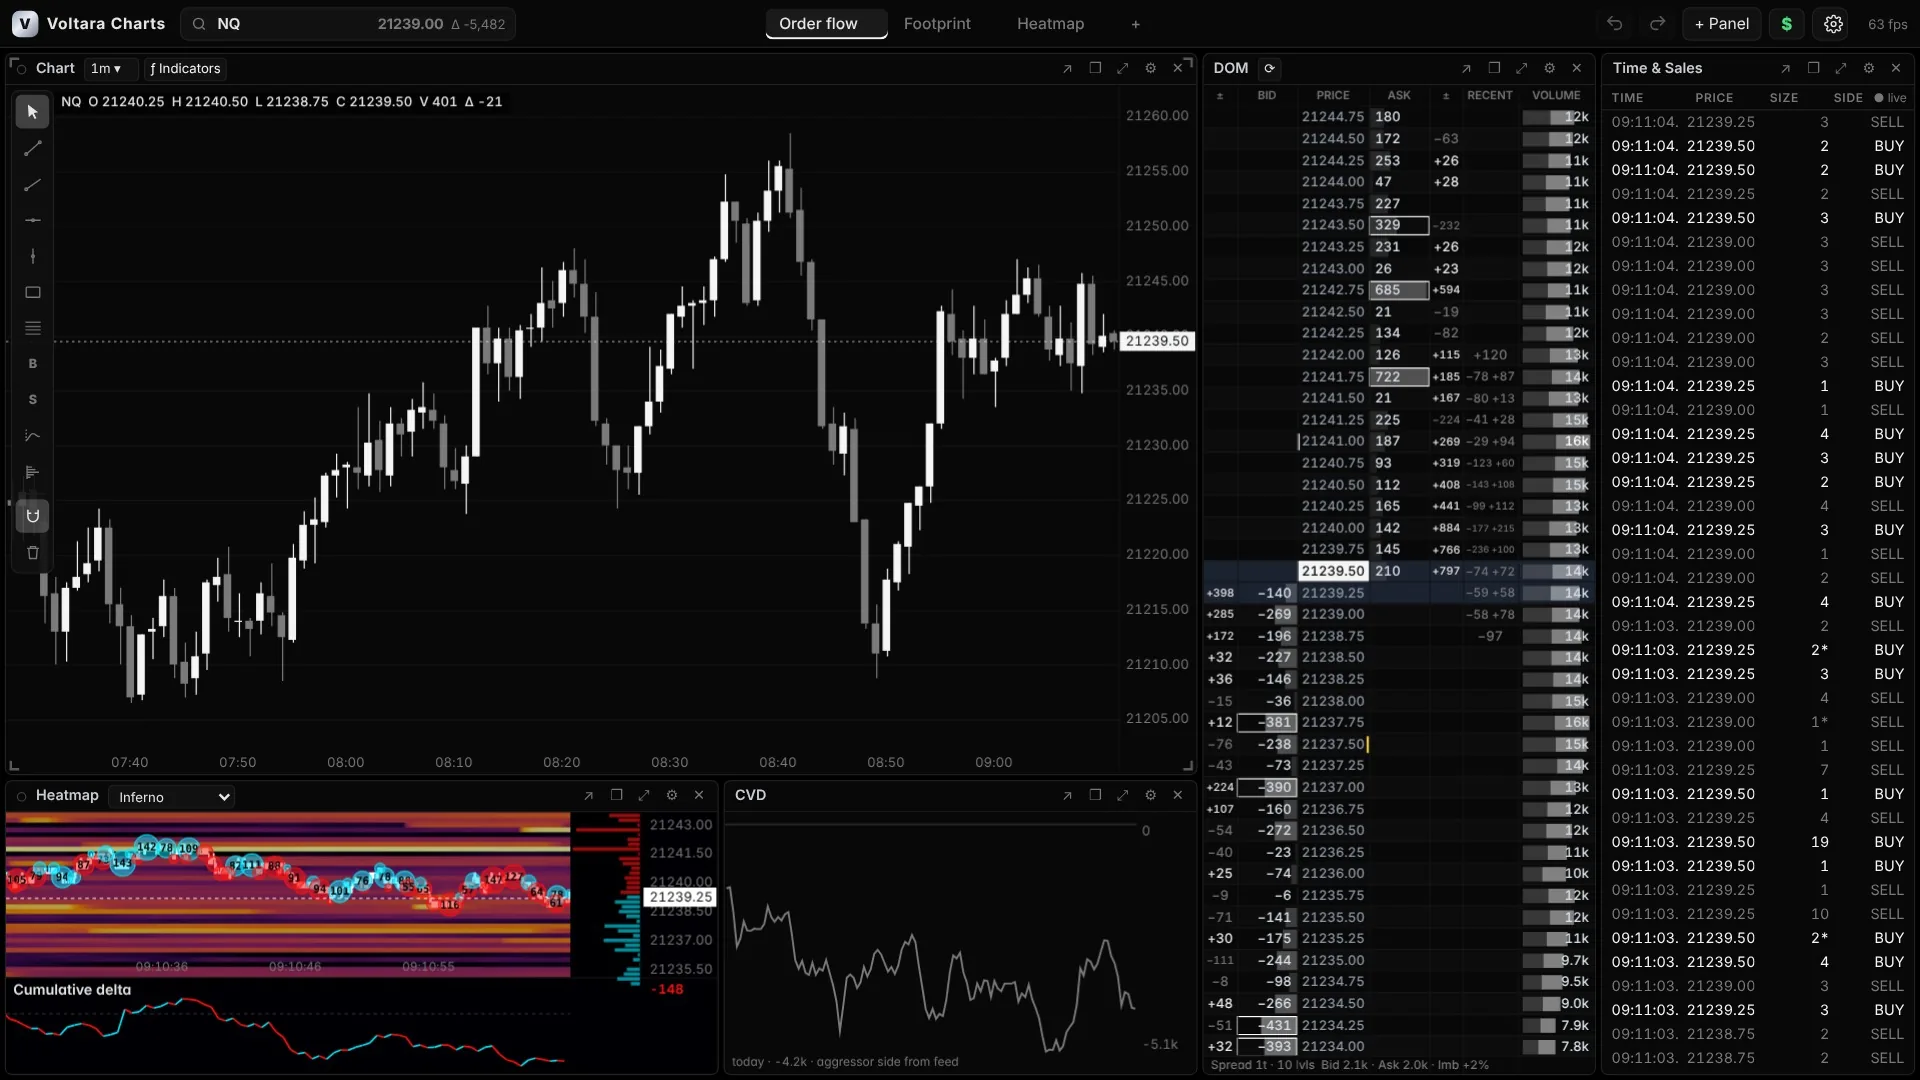
Each panel is built from one trade log, so the footprint, profiles, VWAP and DOM always agree with each other. Screens below are from the current build.
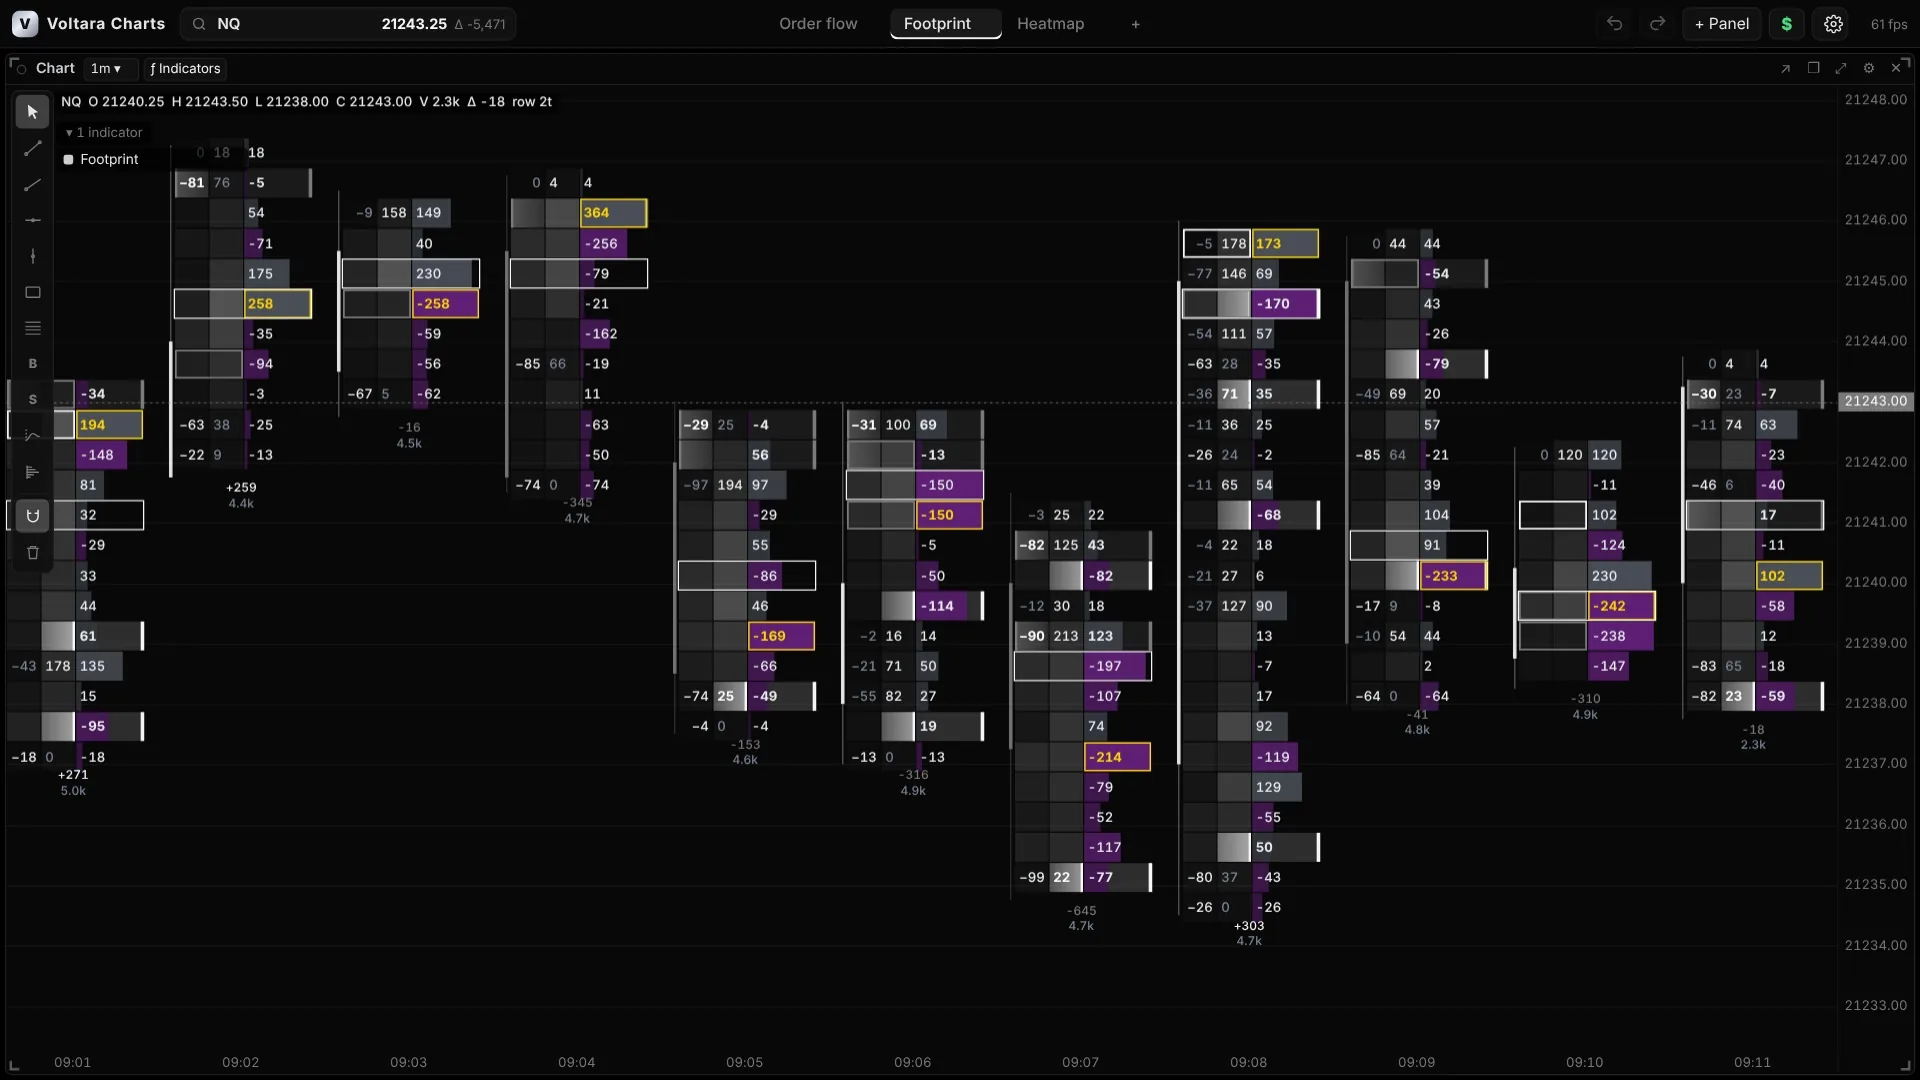
Every contract, at every price.
Bid and ask volume per price, straight from the exchange's aggressor flag.
- Bid × ask, delta, delta %, volume, trade count and average size
- Diagonal and stacked imbalances with your own ratio
- Absorption, exhaustion and unfinished auctions
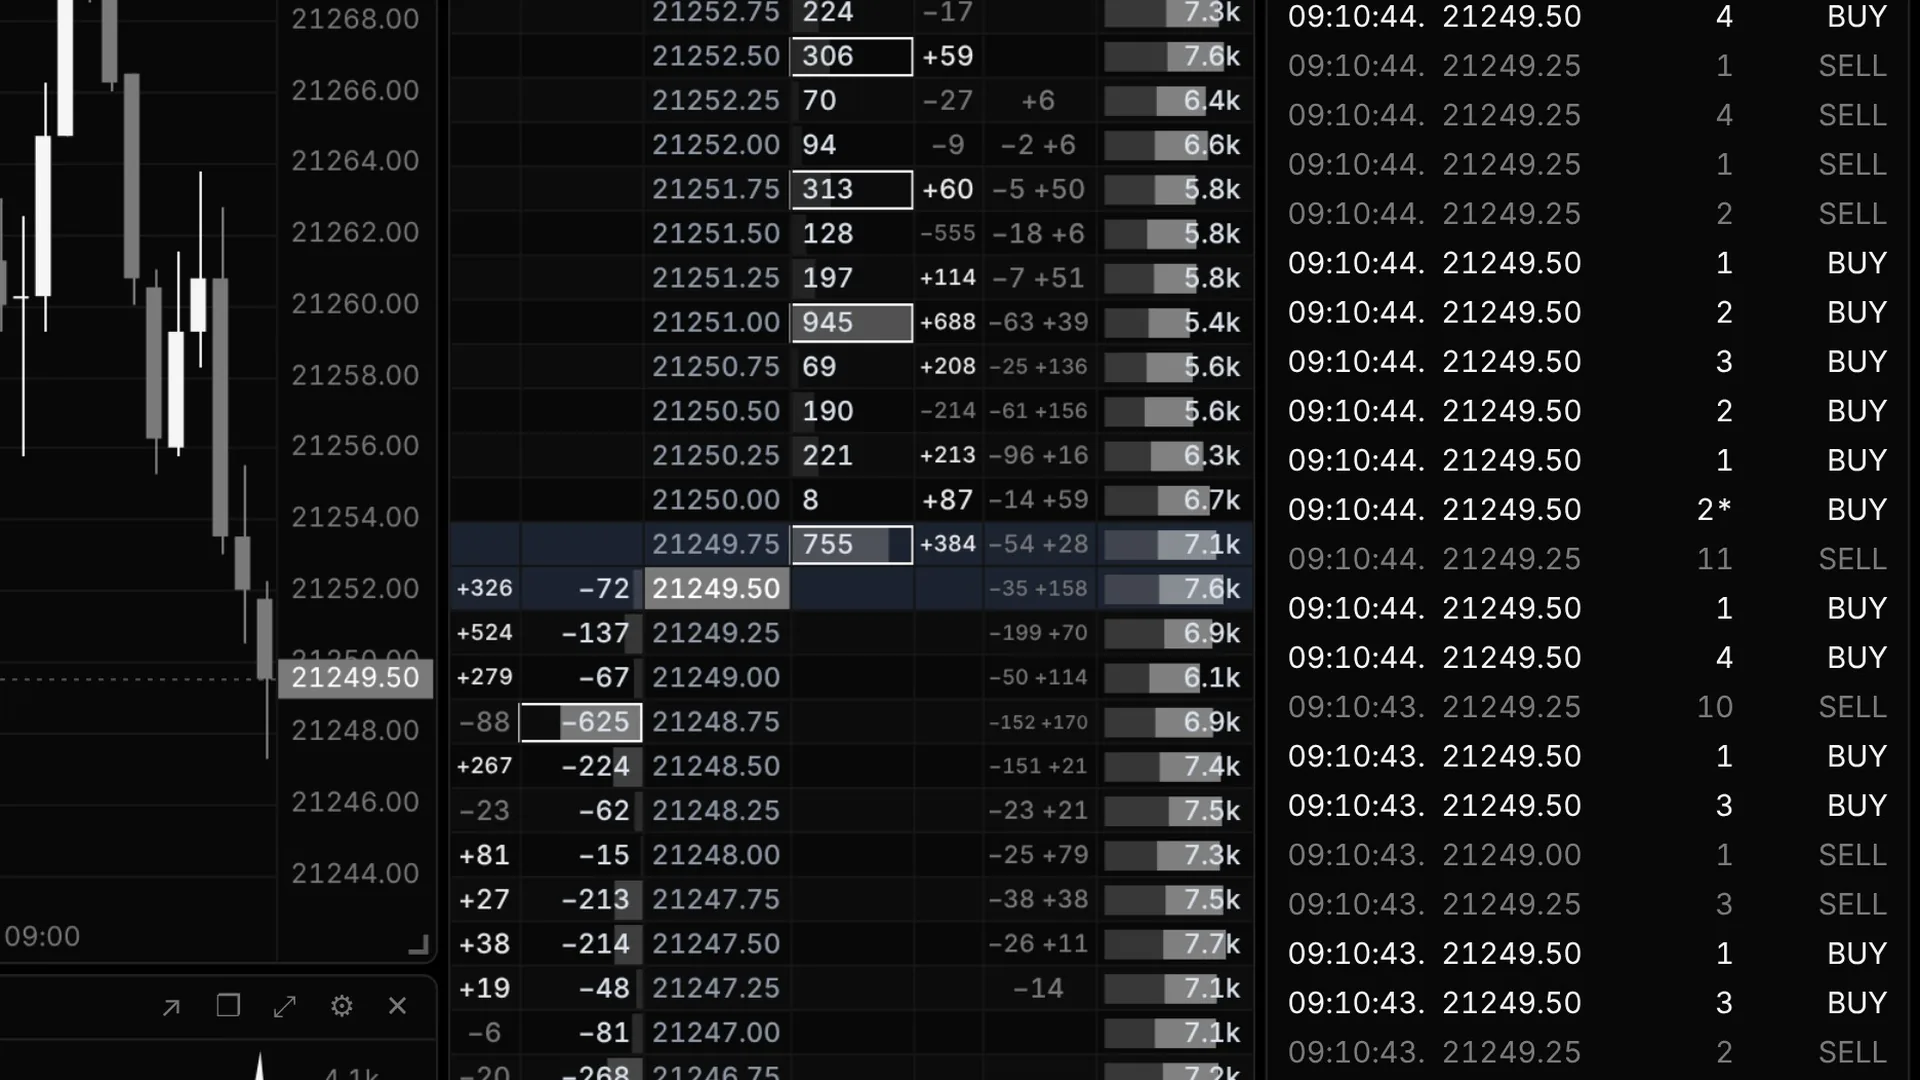
Resting liquidity, pulling and stacking.
The real book at every price, kept apart from traded volume so the two never mix.
- Bid and ask size, cumulative depth and order counts
- Pulling and stacking with fills added back
- Spread, depth and imbalance at a glance; click to trade
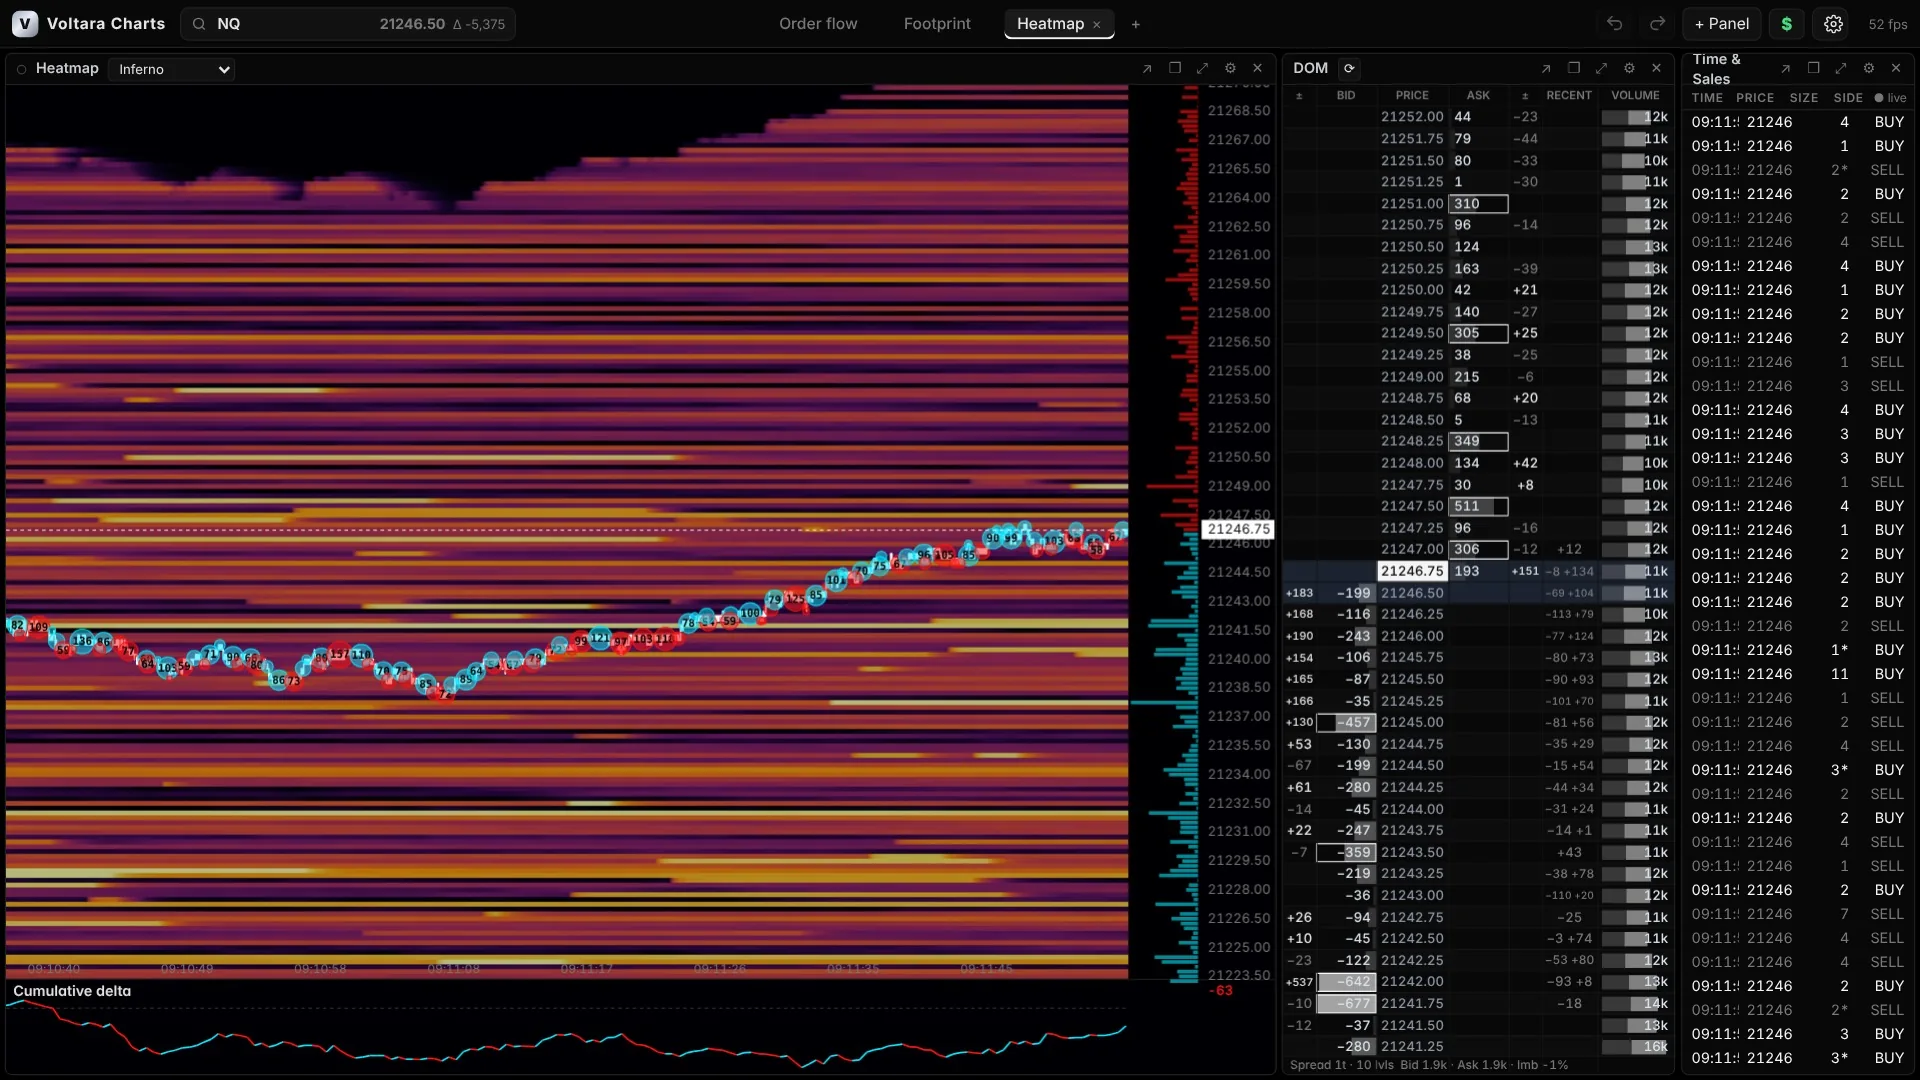
Watch the book build, and pull.
Resting size drawn over time, with big trades marked where they hit.
- Liquidity history with adjustable contrast and palettes
- Big-trade bubbles, merged prints clearly flagged
- Cumulative delta pane underneath
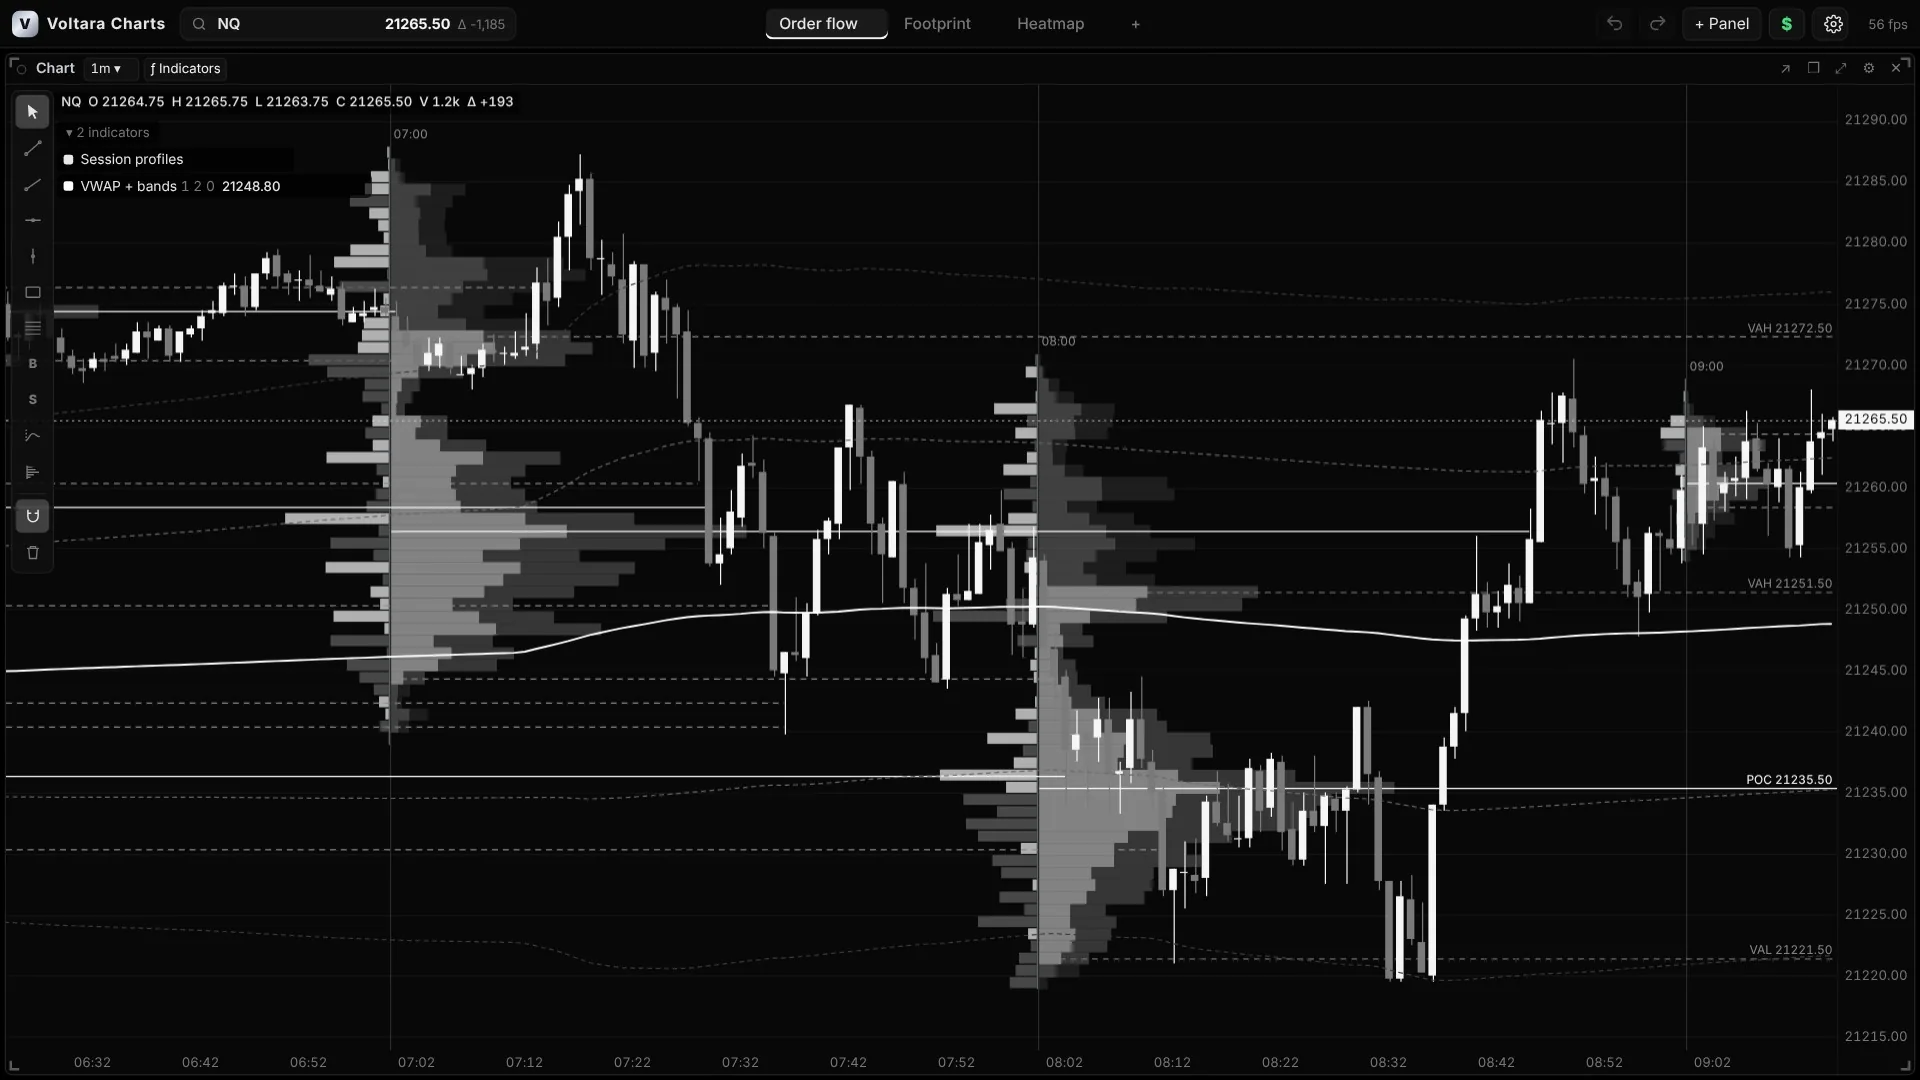
Session, volume and delta profiles.
Value areas by the CBOT or CQG method, TPO brackets from the session open, VWAP from every trade.
- Session, day, week, month or hourly profiles; split or merge any of them
- TPO with initial balance, single prints and rotation factor
- Fixed-range profiles with a delta profile beside them
Your layout, saved.
Pages, panels, indicators, drawings and colors stay exactly as you left them, through restarts and updates.
- Pop panels out to other monitors
- Named workspaces you can save, load and share as a file
- Undo and redo for every change
Numbers you can trace.
Every calculation is checked against independent reference math before a build ships.
Your broker. Your login.
Voltara Charts reads market data through your own broker or prop firm login. Your password is kept by Windows on your PC.
Rithmic
In testingTrades, best bid and ask and market depth through the R | Protocol API, with a guided sign-in. Test it on Rithmic Test before a live account.
dxFeed
PlannedComes after Rithmic, in the same format, so every chart and indicator works the same.
Simulated
Built inPractice data that is always labeled as simulated. Good for learning the layout and building your workspace.
Help shape what ships.
Voltara Charts is in beta while we finish live-data approval with our data partner. Nothing is for sale yet. Testers get a free key for their PC, every feature as it lands, and a direct line to the developer.
opfvoltara@gmail.com · Already testing? Get your key emailed again.
- Your name and what you tradeFutures, markets and timeframes
- The platform you use todaySo we know what you are used to
- Your Rithmic or prop firm setupIf you have one
- We reply with your keyAnd the download link
Before you ask.
Does it place real orders?
Not yet. Orders go to a built-in paper account, or to a Rithmic Test account. Live order routing comes after our data partner approves the app.
Where does my Rithmic password go?
You type it into the sign-in window, and the desktop app encrypts it with Windows and keeps it on your PC. It is not saved in a web page, sent to Voltara Charts, or written to a readable file.
Is the data real?
The default data is simulated and labeled that way everywhere. Test or live data appears only after you connect a provider, and the status bar always says which one you are looking at.
How many computers can I use?
Each key works on one computer. Getting a new PC? Email us and we will move your key.
Windows says the app is from an unknown publisher.
Beta builds are not code-signed yet. Choose More info, then Run anyway.
Can I move panels to another monitor?
Yes. Pop any panel out into its own window, or float it over the chart. It returns to the same spot when you bring it back.